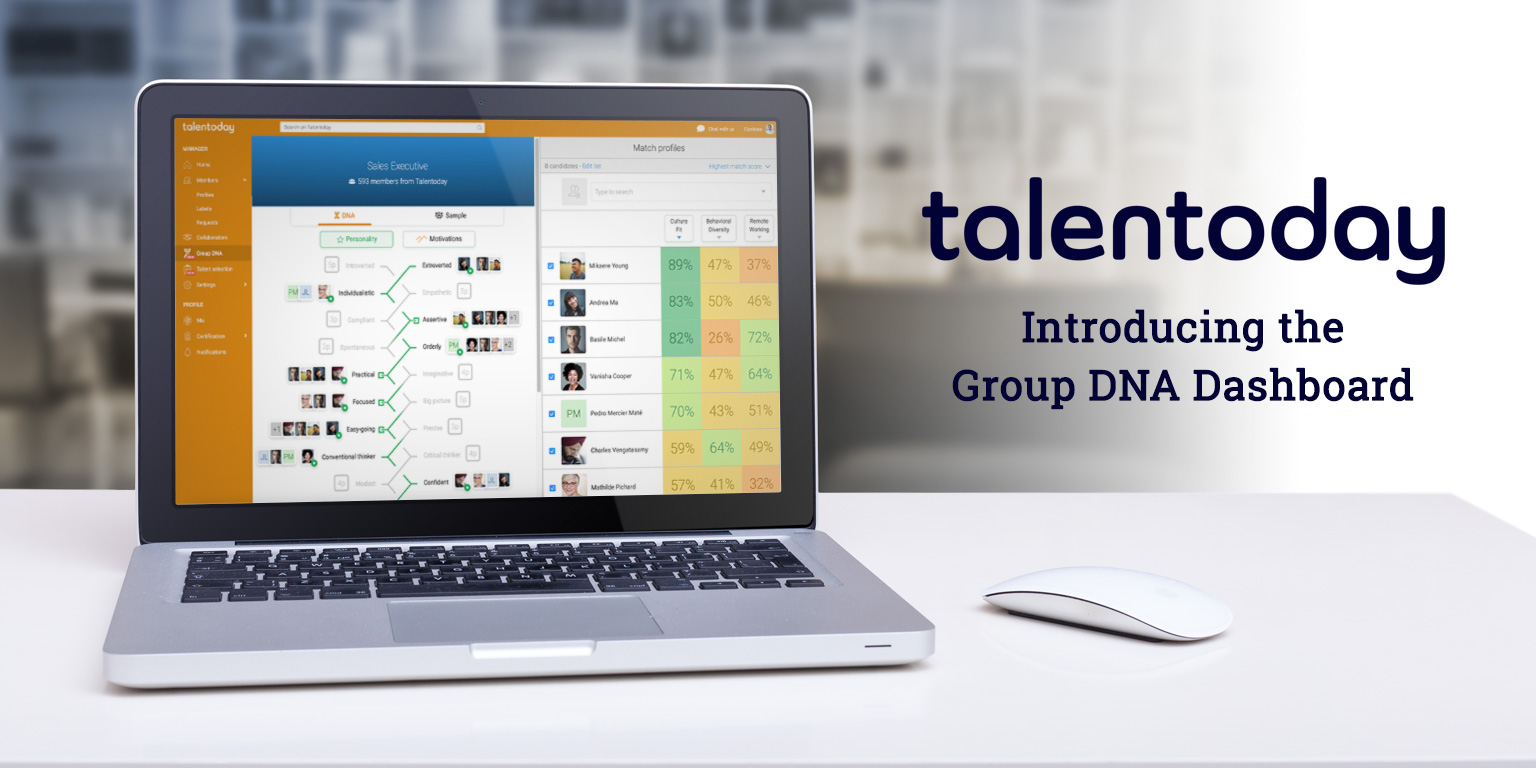
Recruiting and building teams based on hard skills alone has proven to be an inefficient and incomplete hiring and management strategy in today’s world of work. That’s why Talentobe has created the Group DNA Dashboard. It’s a new way to visualize the team profiling and talent matching tools first introduced by Group DNA (GDNA).
Now available in the Talentobe Manager platform, this powerful analytics tool leverages soft skill data to paint a complete cultural picture of a team, company or position. Users can also compare this key information alongside individual profiles to draw important connections between teammates.
Here’s how HR professionals can use the Group DNA Dashboard to power better decision making.
Discover the Group DNA Dashboard
Talentobe’s Group DNA Dashboard helps HR leaders visualize three key areas of people analytics: Culture Fit, Behavioral Diversity and Remote Work.
First, the new dashboard assesses culture fit, a key indicator of potential employee retention rate. This is done by evaluating how an individual matches with the predominant poles of the GDNA, zeroing in on personality traits and motivations that reflect the core values of the targeted team or company.
Second, the tool provides an analysis of behavioral diversity. This is a representation of the potential prevalence of diversity of thought, varied opinions and creative viewpoints in the workplace. To calculate this percentage, the GDNA Dashboard calculates the extent to which an individual diverges from the non-predominant poles of the Group DNA. The higher the percentage of distance, the more an individual can bring balance to the behaviors of a targeted team or company.
Finally, the GDNA Dashboard was built with today’s workplace in mind, dedicating space for key remote working insights. Individual profiles are compared against the results of our Remote Worker Group DNA profile to identify which teammates may excel in a work-from-home or hybrid environment.
Personalizing Your Results
In addition to visualizing these results all at once, users can also sort any matching results according to culture fit, behavioral diversity or remote working ability. This ensures that your decision making process can be as granular as you want it to be.
For example, a design team may be most interested in building their team around creative thinking. In this case, users could use the dashboard to maximize behavioral diversity matches.
On the other hand, a technology team may put more emphasis on boosting retention rates in a tight labor market. To attract the right talent with the skills needed to succeed, this might mean focusing on offering work flexibility and remote work opportunities. Therefore, this team’s dashboard may filter for remote work abilities to find the top matches in these asynchronous environments.
Visualize Team Connections with the Group DNA Dashboard
Interested in seeing how the Group DNA Dashboard helps leaders identify soft skills connections on their teams? Contact our Talentobe team today to learn more about how our latest feature is changing the way teams visualize and act upon soft skills data!

